


Around the World They Go: Circumnavigating Balloon Satellites!


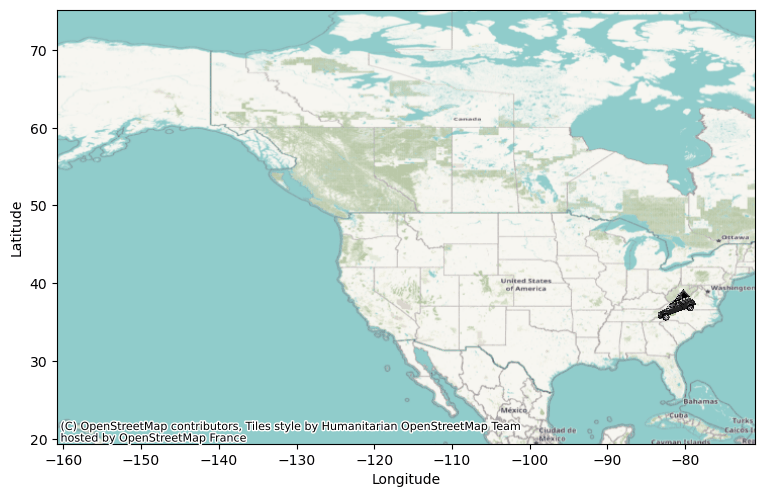
TOP: Superpressure balloon just after launch. Maps displaying balloon trajectories. White diamond represents launch location. Colored lines represent times when the balloon was awake and transmitting data. Straight black lines represent times of no data.

I authored a paper on a project that explored the atmospheric dynamics of the lower stratosphere using micro superpressure balloon satellites (also called pico balloons). This can be found at doi.org/10.1175/BAMS-D-21-0135.1
This student-led initiative aimed to both collect unique atmospheric data and evaluate NOAA’s HYSPLIT trajectory model, a tool widely used for forecasting air parcel movements. We launched three pico balloons, each about one meter in size, designed to maintain a stable altitude of 12–14 km for extended periods. These balloons traversed diverse atmospheric regimes, including:
-
Jet streams over the Himalayas
-
Equatorial air masses over the Pacific Ocean
-
Polar air masses in the Arctic Circle.
The study revealed that while HYSPLIT provided reasonably accurate trajectory predictions, discrepancies arose in certain regions, particularly in areas with complex meteorological conditions or rapidly changing wind patterns. These findings underscore the importance of validating predictive models with real-world observational data, particularly in under-sampled regions of the stratosphere.
Additionally, the project demonstrated the potential of cost-effective, student-built platforms to deliver meaningful scientific data. The initiative was also a major public outreach and educational success. We developed a tracking website that allowed real-time visualization of the balloons’ paths, alongside active social media updates to engage a global audience. This component not only showcased our findings but also inspired interest in atmospheric science.
As a key contributor, I worked on every phase of the project, from working with balloons nd analyzing the trajectory data to authoring the paper and presenting our findings. The experience taught me how hands-on research can bridge the gap between theoretical models and observational science while fostering interdisciplinary collaboration.
Our work provided valuable feedback to NOAA for improving their forecasting tools and demonstrated the power of student-led projects in advancing science and inspiring the next generation of researchers.
LEFT: K4UAH-6 balloon entering and exiting a low pressure system with GEFS ensemble member HYSPLIT analysis. (top left) The synoptic pressure conditions of the area. (top right) Balloon trajectories and ensemble trajectories, with the average GEFS plotted in red, the control GEFS plotted in blue, the balloon indicated by circles with dotted lines, and multiple-colored lines showing all other 30 ensemble members. The separation of ensemble members occurs around 42 h into the forecast. (middle) A 1-h time-step velocity vs forecast time of all members is shown in a box distribution with the members that left the pressure cell plotted in darker blue. (bottom) Resulting distribution of RHTD values; the time interval is roughly 24 h.
List of Publications

Switch tabs to explore my projects!

McKinney, T., Perlaky, N., Mills, M., Stevenson, D., Crawford, A., Brown, B., & Newchurch, M. J. (2024).
The Pico Balloon Archive: Establishing the First Super-Pressure Balloon Satellite Network for Atmospheric Research.
Journal of Atmospheric and Oceanic Technology, 41(11), 1063-1079. https://doi.org/10.1175/BAMS-D-21-0135.1
Acdan, J. J. M., Pierce, R. B., Kuang, S., McKinney, T., Stevenson, D., Newchurch, M. J., Pfister, G., Ma, S., & Tong, D. (2024).
Evaluation of WRF-Chem air quality forecasts during the AEROMMA and STAQS 2023 field campaigns.
Journal of the Air & Waste Management Association, 1-21. Taylor & Francis. https://doi.org/10.1080/10962247.2024.2380333
Helmerich, C., McKinney, T., Cavanaugh, E., & Dangelo, S. (2024). TGFs, gamma‐ray glows, and direct lightning strike radiation observed during a single flight of a balloon‐borne gamma‐ray spectrometer.
Earth and Space Science, 11(2), e2023EA003317. https://doi.org/10.1029/2023EA003317
Kuang, S., Newchurch, M. J., McKinney, T., Perlaky, N., Tucker, P., Stevenson, D., ... & Sullivan, J. T. (2024).
Mobile observations of ozone and aerosols in Alabama: Southeastern US summer Pollution and coastal variability.
Journal of Geophysical Research: Atmospheres, 129(1), e2023JD039514. https://doi.org/10.1029/2023JD039514
McKinney, T., Perlaky, N., Crawford, A., Brown, B., & Newchurch, M. J. (2023). Methodology, deployment, and performance of pico balloons in Antarctica. Journal of Atmospheric and Oceanic Technology, 40(10), 1277-1290. https://doi.org/10.1175/JTECH-D-23-0047.1
McKinney, T., Perlaky, N., Newchurch, M., & Brown, B. (2023). Insights on polar day Antarctica radio propagation using amateur radio beacons on circumnavigating balloons. Atmosphere, 14(7), 1118. https://doi.org/10.3390/atmos14071118
Stark, J., McKinney, T., Booker, Q., Downey, M., Golley, E., Marshall, T., ... & Thompson, J. (2023). A Platform for Active Stabilization of High-Altitude Balloon Payloads. Bulletin of the American Meteorological Society, 104(6), E1132-E1145. https://doi.org/10.1175/BAMS-D-22-0042.1
McKinney, T., Perlaky, N., Danielson, E., Mohammed, A., Lee, J., O’Bryan, B., ... & Knupp, K. (2023). Around the world they go: Circumnavigating balloon satellites! Bulletin of the American Meteorological Society, 104(6), E1132-E1145. https://doi.org/10.1175/BAMS-D-21-0135.1
A Platform for Active Stabilization of High-Altitude Balloon Payloads
I co-authored a paper introducing the High-Altitude Vehicle for Observing Circulation (HAVOC), a novel platform designed to stabilize high-altitude balloon payloads during flight. This paper can be found here: doi.org/10.1175/BAMS-D-22-0042.1 Uncontrolled rotation caused by high-altitude winds often degrades data quality from balloon-borne instruments. To address this, HAVOC employs a cold-gas thruster system capable of precise rotational control. The system integrates lightweight materials, compact electronics, and an active control algorithm to ensure payload stability in challenging conditions. The design prioritizes accessibility, with a total cost under $1,000, making it viable for researchers and educational purposes.
Through a series of test flights, HAVOC demonstrated significant stabilization capabilities. In a stabilization control flight, HAVOC reduced payload rotation from a peak of ±100°/s to within a user-defined threshold of ±40°/s in just 320 milliseconds, maintaining this level throughout the flight. Another flight tested azimuth control, where the payload held a fixed orientation within ±30° for over an hour at altitudes up to 22,600 meters before exhausting its propellant. These results highlight HAVOC's effectiveness in enhancing data quality for a variety of applications, including videography, atmospheric sensing, and remote observation. HAVOC represents a significant advancement for high-altitude research, offering stabilization solutions for scientific and educational missions alike. The platform’s ability to reduce rotation and maintain orientation improves data accuracy, particularly for temperature profiles, imaging, and other directional sensors. As a co-author, I contributed to the system design, data analysis, and documentation of the findings. This work provides a foundation for future improvements, including integrating a gimbal system for advanced observation and adapting thrust control for varied atmospheric conditions. HAVOC’s success illustrates the potential for affordable, accessible technology to advance atmospheric science.


LEFT: Photos of the HAVOC System in flight. (a) Downward-facing camera above the HAVOC system on an 11 Apr 2021 flight, (b) horizontal camera view at 20,000 m from the HAVOC system on a 9 Apr 2022 flight, and (c) HAVOC payload and balloon line just after launch on 9 Apr 2022. (top) Three-dimensional model of current HAVOC equipped payload; all values are in meters unless otherwise noted. (bottom) Cross-sectional view with annotated components parts. Total payload weight: 5.56 lb (2,522 g).
The Pico Balloon Archive: Establishing the First Super-Pressure Balloon Satellite Network for Atmospheric Research
I mange the Pico Balloon Archive (PBA), a groundbreaking platform that establishes the first super-pressure balloon satellite network for atmospheric research. This network leverages lightweight, cost-effective pico balloons that can remain aloft for months to years. The PBA (picoballoonarchive.org) serves as a centralized resource, providing access to flight details, downloadable raw data, and visualizations via an online portal. A picture showing the data work flow is shown below.

A recent paper was published by me at doi.org/10.1175/JTECH-D-24-0034.1 By validating the archive’s wind speed and direction calculations against NOAA’s Integrated Global Radiosonde Archive (IGRA), the PBA demonstrated strong correlations (R² = 0.66 and 0.78, respectively), highlighting its potential for supporting global atmospheric studies. Key findings include the ability of pico balloons to trace atmospheric circulation patterns with unprecedented temporal and spatial coverage. The average flight duration of these balloons is 107 days, with some lasting up to 555 days, and their data spans critical atmospheric regions, including the upper troposphere and lower stratosphere. The PBA’s data analysis revealed notable insights into global circulation, such as the dynamics of jet streams, seasonal variations in float altitudes, and rare hemispheric crossings. For instance, one balloon traveled from the Arctic stratosphere to the Southern Hemisphere, crossing the equator by utilizing unique stratospheric wind patterns.


TOP: Example plot from the PBA website showing the full dataset. RIGHT: Float altitude vs. latitude of the PBA. Top-A) plots boreal spring and summer data, Bottom-B) plots boreal fall and winter data. Notations are A- Jet streams, B- Antarctic and Arctic stratospheres, C- lower tropical stratospheres. Average barbs showing mean pico balloon wind speed at 5 degree latitude 500 m altitude bins. The Rieckh (2024) tropopause height are shown by shades and dotted lines. The standard climate cells are notated by latitude range. The right y-axis plots the standard atmosphere pressure and density associated with each altitude.
TOP: Flow chart and schematic showing how the PBA collects data.
Insights on Polar Day Antarctica Radio Propagation Using Amateur Radio Beacons on Circumnavigating Balloons

TOP: Maps showing the locations of the balloons during the study period, locations of the DP0POL Icebreaker, Neumayer Station, and all the WSPR stations decoding balloon telemetry throughout the study period.


TOP: Spot 2D-Histogram of solar elevations during balloon transmissions vs. signal travel distance.
TOP: Spot 2D-Histogram of solar elevations during balloon transmissions vs. solar elevations of the receiving stations. A 1-to-1 line is plotted. Dotted lines indicate short hops decoded by the DP0GVN station.
I authored a paper that explored the use of six circumnavigating pico balloons equipped with 20-meter amateur radio transmitters to study ionospheric radio propagation during the polar day in Antarctica. The full work can be found at doi.org/10.3390/atmos14071118
I launched these balloons from Neumayer Station III during the 2022 Antarctic summer and utilized the Weak Signal Propagation Reporter (WSPR) protocol to transmit telemetry data globally. The balloons were designed for extended-duration flights, with one remaining airborne for an impressive 98 days, completing eight circumnavigations of the Southern Hemisphere. This long-term performance allowed for a detailed analysis of radio signal behavior in the unique high-latitude environment of Antarctica.
The study focused on understanding how solar elevation angles and the geographic distribution of the WSPR network affected long-range radio propagation.
Signal Reception Ranges:
-
Most signals were decoded at distances of 1000–5000 km.
-
Long-range signals (>7500 km) required solar angles below 60 degrees at both ends of the transmission.
Polar Propagation Dynamics:
-
Reception peaks occurred around 4 UTC, aligning with favorable ionospheric conditions during early morning hours.
-
Remote regions like South America and India showed limited reception due to sparse WSPR network coverage.
Balloon Performance:
-
Average flight durations were impressive, with one balloon achieving 98 days aloft.
The network captured data spanning multiple circumnavigations, offering a global perspective on propagation characteristics. This research underscores the potential of cost-effective pico balloons as platforms for studying ionospheric behavior, particularly in extreme environments. By leveraging these balloons, we were able to identify key propagation patterns, validate their dependence on solar geometry, and expose gaps in WSPR network coverage. The findings not only provide a deeper understanding of atmospheric processes but also suggest ways to improve global communication networks in high-latitude and under-sampled regions.

LEFT: Depiction of the 20 m WSPR payload varieties flown in this study. (A) KW5GP payload built by the W5KUB group, (B) KD9UQB payload built by the NIBBB group, and (C) WB8ELK Skytracker flying the KN4TPG, KM4LVC, WB8ELK, and KM4ZIA call signs.
Methodology, Deployment, and Performance of Pico Balloons in Antarctica

TOP: Me about to launch a pico balloon outside Neumayer Station III.


TOP: Polar maps showing six of the long-duration balloon flights. The black dots over the flight paths show points when the balloon transmitted a data point. Colored lines are linearly interpolated between black dots. Also, balloon data from the six long-duration flights. Altitudes are in m MSL. Latitude vs time plots are colored by the speed of the balloon. Altitudes, U, and V line plots correlate to the colors on the maps.
During the 2022/23 Antarctic summer, I conducted research deploying eight pico balloons from Neumayer Station III to investigate Antarctic stratospheric wind patterns. These low-cost, lightweight balloons, transformed from commercially available party balloons, floated at altitudes between 9 and 15 km, significantly lower than traditional superpressure balloons. One of the deployed balloons achieved an exceptional 98-day flight, completing eight circumnavigations of the Southern Hemisphere and highlighting the potential of these small-scale platforms for long-term atmospheric studies. More details of this can be found at https://doi.org/10.1175/JTECH-D-23-0047.1
My study revealed critical findings on wind speeds and circulation in the Antarctic stratosphere. Zonal velocities ranged from –250 to 250 km/h, while meridional velocities varied between –100 and 100 km/h, with total wind speeds reaching 270 km/h. Analysis showed that convection under certain atmospheric conditions could temporarily increase float altitude by altering the balloon’s density. Additionally, the balloons consistently drifted farther south than larger super pressure balloons, reaching latitudes as close as 2° from the South Pole, providing new insights into Antarctic atmospheric dynamics.
I also developed a reliable pressure-testing process for these balloons to analyzing flight data and refining deployment techniques. The research demonstrated how simple, inexpensive materials can be leveraged for impactful scientific investigations, offering a scalable, cost-effective alternative for atmospheric studies in extreme environments like Antarctica. This project underscores the utility of pico balloons for enhancing our understanding of stratospheric processes, with minimal logistical requirements—carried out entirely with equipment that fits in a carry-on bag.


Some fun photos from my time on the ice!
AEROMMA 2023
In 2023, I contributed to the AEROMMA Campaign, an intensive air quality study designed to investigate ozone formation and transport over the western shore of Lake Michigan. This campaign, conducted from July 18 to August 16, 2023, deployed advanced atmospheric monitoring systems to expand on findings from previous studies, such as the Lake Michigan Ozone Study (LMOS) 2017. The project emphasized understanding the meteorological and chemical interactions responsible for elevated ozone levels in downwind locations like Kenosha County, Wisconsin.


The campaign utilized a diverse array of instruments, including NASA’s TOLNet Ozone LiDAR, a Doppler Wind LiDAR, weather and ozonesondes, and a SeaRey amphibious aircraft for boundary-layer measurements. A total of 73 balloon soundings and 180 drone flights were conducted, providing high-resolution vertical profiles of ozone, aerosols, and meteorological variables. These data revealed the critical role of lake breezes in transporting emissions and triggering photochemical ozone production. For instance, on July 25, 2023, a significant exceedance event occurred where surface ozone peaked at 117 ppbv, with LiDAR measurements indicating elevated ozone concentrations of 150 ppbv aloft. This case demonstrated how lake breezes trap and recirculate pollutants, exacerbating air quality issues along the shoreline.My work in this campaign focused on analyzing the interplay between meteorology and air quality during ozone exceedance events. I contributed to the deployment of mobile and airborne platforms and the interpretation of data from multiple sources, including drones and LiDAR.
TOP LEFT: 25 July 2023 exceedance event at Chiwaukee captured from sondes, LiDARs, and surface measurements. BOTTOM LEFT: SeaRey's flight from Chicago to Kenosha on August 10, 2023, is depicted. The aircraft's altitude (derived from DWL winds), ozone, NO2, PM2.5, and meteorological measurements are plotted against time. Additionally, a map displaying the flight track colored by altitude, accompanied by HRRR 3km wind barbs at 10m AGL at 23Z, is presented. In the top right corner, data from an ozonesonde launched from Chiwaukee is shown. TOP RIGHT: Photos of aircraft, balloon, and ground site on the coast of Chiwaukee.
2024 North American Eclipse Ballooning


TOP: NASA and Fox News showcasing my balloon selfie stick payload. Right: Data taken from one of the radiation detector payloads; plotting temperature, humidity, winds, and radiation data vs. altitude, and a photo of four payloads before flight.
I had the incredible opportunity to design, build, and launch a series of weather balloons for the 2024 North American Eclipse. In addition to leading these flights, I served as the team lead for the National Eclipse Ballooning Program (NEBP) in Alabama. This role allowed me to mentor over 20 undergraduate students, teaching them the intricacies of high-altitude ballooning and fostering a hands-on learning environment. The payloads we developed were diverse and innovative, featuring an atmospheric science module to measure stratospheric conditions, a radiation payload to monitor solar activity, and multiple camera systems to capture the breathtaking eclipse from the edge of space. These balloons successfully collected valuable scientific data and stunning video footage before, during, and after totality. Our efforts gained significant recognition, with the awe-inspiring footage being broadcast on news outlets and featured on NASA’s social media platforms. It was a proud moment to see our work contribute to the broader understanding of the eclipse while inspiring public engagement with science and exploration.


CHECK OUT MY AWESOME VIDEOS!!!
Journey to the Arctic Circle
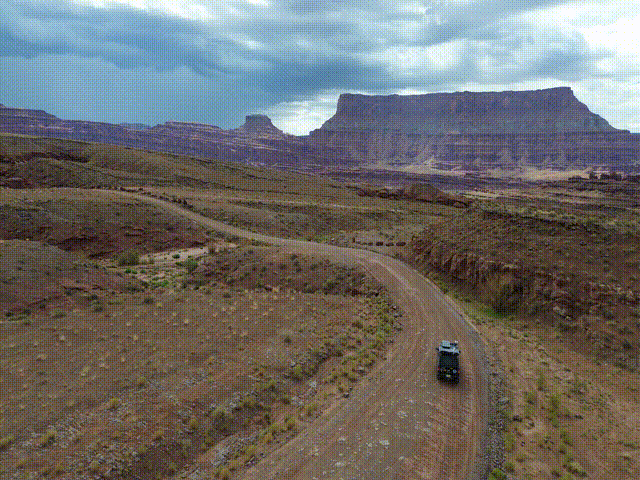
In the summer of 2024, I embarked on an unforgettable expedition to the Arctic Circle in my custom-outfitted ToddTruck. This journey was more than just an adventure—it was a mobile atmospheric research mission. I transformed my truck into a sophisticated rolling laboratory, equipping it with an array of advanced meteorological sensors designed to collect detailed environmental data. Every measurement was meticulously geotagged with precise GPS coordinates, creating a robust dataset that documented the journey in exceptional detail.
The custom-built sensor on my truck measured temperature, humidity, pressure, PM2.5, and other key environmental parameters. A real-time dashboard displayed the data as I drove, offering immediate insights into changing conditions across North America.
The journey began in North Carolina, taking me northwest through Canada’s wilderness (and forest fire smoke) to Alaska. I traversed the legendary Dalton Highway, reaching the Arctic Circle and the icy shores of the Arctic Ocean—an really awesome accomplishment in my view. From there, I traveled south along the scenic west coast of the United States before heading east to complete the journey. Covering thousands of miles, the expedition provided invaluable atmospheric data and unforgettable views. I look forward to analyzing the data more and publishing soon!
TOP: Gif of the route I took retrieved from my atmospheric science sensor.

TOP: Quick look plot of location of the drive with temperature, relative humidity, and PM2.5 measurements with some cool features noted. RIGHT: Some great photos/gifs from the trip!


TGFs, Gamma-Ray Glows, and Direct Lightning Strike Radiation Observed During a Single Flight of a Balloon-Borne Gamma-Ray Spectrometer
This was a very fun project where myself and others used a balloon-borne gamma-ray spectrometer to investigate high-energy radiation in thunderstorms. A balloon flight over northern Mississippi on June 19, 2023, recorded three distinct terrestrial gamma-ray flashes (TGFs), prolonged gamma-ray glows associated with thunderstorm electric fields, and radiation from a direct lightning strike that hit the payload at 11.9 km altitude. You can read more about this event at doi.org/10.1029/2023EA003317
During the flight, the balloon was struck by lightning, causing the balloon to burst. Despite this, the core radiation detection systems continued to function, capturing valuable data during the payload's descent. The gamma-ray spectrometer was able to correlate radiation events with lightning activity recorded by ground-based and satellite systems, including the Geostationary Lightning Mapper (GLM) and North Alabama Lightning Mapping Array (NALMA).
The study documented the millisecond-long TGFs, the sustained gamma-ray glows lasting up to two minutes, and the radiation patterns during the lightning strike, providing insights into the processes of lightning leader propagation and return strokes. This work highlights the potential of balloon-based platforms for studying high-energy atmospheric events and contributes to understanding how thunderstorms generate and interact with radiation.


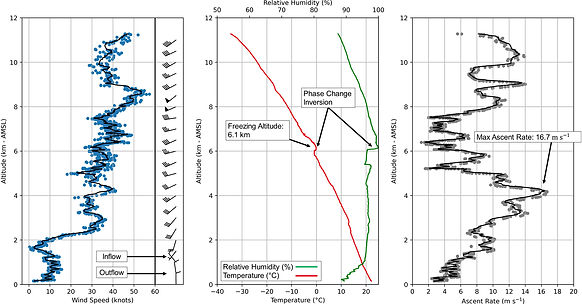
TOP: Balloon flight a few moments after launch into a thunderstorm over Huntsville, AL, USA, on 25 June 2023. Parts of the HELEN balloon line are labeled. TOP RIGHT: Inside of a high energy lightning emission network payload. (A) LYSO:Ce scintillator crystal coupled with a Hamamatsu R6095 photomultiplier tube for radiation detection, (B) DE-10 Standard Development Board with ADC Card for processing radiation pulse data, (C) Raspberry Pi-based optical camera capturing 1080p video for lighting flashes, (D) 18650 battery power supply, (E) Power distribution board, (F) Environmental data acquisition board(s) recording temperature, GPS timing/location, and payload orientation. TOP RIGHT: Depictions of location and altitude for the lightning strike event. (a) upper plot displays the nearest KGWX radar returns to the event, incorporating LMA signals within ±60 s and ±1 s of the lightning strike, and geostationary lightning mapper (GLM) locations ±60 s of the lightning strike using contour kernel density estimate. The number of GLM flashes using a contour estimate are labeled. (b) illustrates the KGWX reconstructed RHI to the high energy lightning emission network payload during the radiation occurrence, highlighting the altitudes of LMA signals and the payload itself. The bottom plot is adjusted to the distance and elevation relative to the KGWX radar, where LMA data within a 1-degree FOV of the KGWX beam are plotted. MIDDLE: Meteorological parameters from the balloon flight. Features of note are labeled. BOTTOM RIGHT: Meteorological parameters from the balloon flight. Features of note are labeled.

PTH100: A Low-Cost Breakout Board for Research Grade Atmospheric Science Measurements
I have always envisioned a low-cost breakout board capable of delivering high-quality atmospheric science measurements. Traditionally, low-cost sensors tend to exhibit a significant warm bias, but the PTH100 changes the game! Its design is inspired by radiosonde probes, utilizing an ultra-sensitive thermistor for precise temperature readings. All measurements are seamlessly converted to I2C, ensuring ease of use and integration. I've tested the PTH100 across a variety of platforms, including drones, balloons, vehicles, and airplanes, and it consistently delivers outstanding performance. It’s an exceptional solution for achieving high-quality atmospheric science measurements at an affordable price! See below for a poster and the data sheet. I hope to be offering this on my sensor shop soon!
Rainmaker: Cloud Seeding Operations with NEXRAD and HYSPLIT Integration
I had the privilege of working with Rainmaker, an innovative startup specializing in cloud seeding operations using drones. I was brought on to focus on meteorological instrumentation, including managing ceilometers, surface weather stations, and analyzing radar data. Shortly after joining the team, I spent a winter season in Pendleton, Oregon, where I contributed to field operations and further developed my expertise in atmospheric data collection.

During my time at Rainmaker, I expanded the capabilities of the PTH (pressure, temperature, humidity) sensors I had previously designed, adapting them for deployment on drones. This hands-on work allowed me to refine the sensors' functionality for aerial operations, an exciting and rewarding experience that bridged my engineering and atmospheric science skills. In addition to instrumentation, I developed tools to integrate NOAA’s HYSPLIT dispersion model with NEXRAD radar data. These tools were designed to streamline the detection of seeding signatures by overlaying modeled dispersion plumes onto radar reflectivity data. The goal was to identify potential alignment between dispersion model outputs and radar features, which could indicate a successful seeding event. This project was both challenging and fulfilling, as it combined advanced modeling, real-time data analysis, and operational meteorology to address a practical application. Overall, my work with Rainmaker was an enriching experience that not only honed my technical skills but also allowed me to contribute meaningfully to cutting-edge atmospheric science and drone technology.
TOP: Here is an example output from my automated HYSPLIT dispersion model bot. The analysis includes atmospheric profiles, cloud cross-sections, and details on particle mixing downwind of the source.


TOP & LEFT: Photos of ToddTruck in Oregon during field operations. My PTH sensor mounted on a drone, prepared for flight. RIGHT: An example HYSPLIT-NEXRAD combination plot illustrating maximum reflectivity features, a particle dispersion polygon, and a centerline marked with a plus symbol. Additional plots display particle positions across altitude, latitude, and longitude.

Rainmaker: Super Cooled Liquid Water Radiosonde Study
While working at Rainmaker, I was involved in a field campaign at Pendleton, Oregon to explore how supercooled liquid water and ice distribute themselves in thin stratiform and mixed-phase clouds. Over the course of several weeks, I launched 34 radiosondes through forecasted cloud layers, carefully selecting launch times when temperatures hovered between 0 °C and –20 °C and humidity exceeded 80 %. The goal was to capture the vertical structure of cloud microphysics under real-world midlatitude conditions, where Pacific moisture meets cold continental air.
.png)
TOP: A) Me with weather balloon shortly before launch, B) iMet-4RSB with Anasphere UWC sonde flight line, C) internal view of the Anasphere UWC with the two vibrating wires.

LEFT: Selected cases during the campaign showing profiles of temperature, dewpoint, potential temperature, Brunt–Väisälä frequency, SLWC, IWC, and relative humidity. Local CL31 backscatter profiles are shown one hour after each sonde launch and snapshots of GOES cloud top and NEXRAD reflectivity are shown. Dates for cases are A) 2025-01-10, B) 2025-03-03, and C) 2025-01-05.
BOTTOM: Clouds on 2025-01-10.

For each flight, an Anasphere UWC-2 sensor—using vibrating-wire technology to distinguish liquid droplets from total water content—alongside an iMet-4RSB package recording temperature, pressure, humidity, and wind. I synchronized these pseudo-Lagrangian profiles, sampled every three seconds, with ground-based observations from a Vaisala CL31 ceilometer and a METEK MRR-Pro radar. This setup allowed me to link cloud-base heights, backscatter layers, and precipitation structure to in-situ measurements of supercooled liquid water (SLW) and ice water content (IWC). When I processed and analyzed the data, a clear pattern emerged: SLW concentrations peaked near –7 °C, identifying a “sweet spot” where droplets remain liquid despite subfreezing temperatures. I also discovered that strong temperature inversions—layers of enhanced stability—act like lids, trapping liquid water and inhibiting vertical mixing. In contrast, when stability weakened, ice formation intensified, leading to mixed-phase transitions. Through this work, I demonstrated that both vertical stability and cloud depth are critical controls on phase partitioning in winter midlatitude clouds.
Dynamics INstrumentation for GOndolas (DINGO)
NASA Balloon Program

One of my first projects with the NASA Balloon Program: DINGO, a payload for NASA’s BLOOM program that measures orientation using an two onboard IMUs. It also has a PTH sensor and dual cameras—one downward-looking and one side-viewing—alongside a GPS. It’s run using Raspberry Pi 5, for which I designed a custom HAT that converts 28 V flight power bus into stable 5 V and 3.3 V. The board plugs directly into the Pi’s GPIO header, creating a compact, rugged package optimized for flight. Dingo synchronizes orientation data with high-resolution imagery to characterize parachute deployment and in-air behavior. I aim to fly this payload on a summer zero pressure balloon test flight to generate insights for improving parachute design and deployment models.


ABOVE: DINGO payload housed in a custom PLA printed box. The payload is built so electronics can slide out from the main payload body.

ABOVE: Schematic of custom PCB hat for the DINGO payload.
Global UTLS Transport Connectivity and Altitude-Gated Hemispheric Exchange Revealed by Super-Pressure Balloon Network


ABOVE: Top - PBA data used in the study, Bottom - Mean wind speeds on map and mean wind at each float altitude.

I analyzed the Pico Balloon Archive (PBA)—my live, multi-year record of super-pressure balloon trajectories at ~10–16 km—to quantify UTLS lateral transport from observations alone. Treating each flight as a quasi-Lagrangian parcel, I derived seasonal flow fields, residence times, and transition rates among six latitude bands. The workflow is simple and reproducible: compute parcel displacements directly from GPS tracks, form seasonal composites, and summarize movement with transition matrices and chord diagrams. The central result is that float altitude controls interhemispheric exchange. Shifting the mean float height by only a few hundred meters changes both the probability of crossing the equator and the crossing time—weeks to months around ~13–15 km versus much longer near ~12.5–13 km. This turns a qualitative idea into a quantitative requirement: models and trajectory tools should resolve roughly 100–300 m vertical structure to represent real UTLS pathways and residence-time gradients. The PBA products also map where parcels persist and where exchanges are favored: fast jet corridors, slower monsoon-periphery zones, and tropical pathways that open seasonally. These observation-derived benchmarks let dynamics/STE groups test pathway hypotheses and give chemistry–climate and reanalysis teams an external, measurement-only target for transport evaluation, independent of model winds. This paper is currently being reviewed by GRL!

Above: Exposure-normalized latitude–band transport rates at 10–16 km. Boreal winter/fall and spring/summer (bottom). Heat maps and chord diagrams show dwell-time–normalized transition rates, so widths and colors reflect the propensity for parcels in a band to move to another, independent of sampling density. Bands are SH Polar, SH Midlatitudes, SH Tropics, NH Tropics, NH Midlatitudes, and NH Polar. Chords are directed: they originate at the source band arc and point to the destination.
Above: Time to first crossing vs. starting float altitude (log fit). Time series for crossing balloons: latitude, wind speed, wind direction, and float altitude (0–5~months on left; 5–22~months on right for a long-duration case).
Modeling Liquid Water, Ice, and Super Cooled Liquid Water with Custom WRF Simulations

Above: Time-evolving WRF outputs of cloud microphysics and reflectivity across East Asia, illustrating realistic mesoscale cloud dynamics and mixed-phase processes.
This work involved configuring and running the Weather Research and Forecasting (WRF) model at convection-resolving resolution to study cloud microphysics over East Asia. The setup used nested domains down to 1–3 km spacing with the Thompson aerosol-aware scheme and RRTMG radiation to explicitly resolve mixed-phase processes. I developed a reproducible pipeline for preprocessing, domain generation, and batch runs on high-performance nodes, with automated post-processing to extract liquid water, ice, and reflectivity diagnostics. The system produced stable 24-hour integrations with realistic cloud-phase partitioning and vertical SLW structure, suitable for icing risk analysis and validation against radar or satellite data. This workflow serves as a base for future assimilation and AI-coupled microphysics experiments.

Above: Supercooled liquid water cross-section from high-resolution WRF simulation showing vertical cloud structure and freezing-level transitions.